What is Sankey Diagram in Analytics

Ever heard about a Sankey Diagram? I know you do, but your quest to learn it brought you to this blog. Welcome, buddy!
In this blog, I am going to explain what SANKEY CHART looks like and how it can be useful for you in any business case study. Let’s first see what it looks like, in the next image.
Indeed Sankey chart has been so popular these days in the context of Advance analytics, no matter what, it looks stunning and more comprehensive to the end-user.
The Great Sankey Diagram
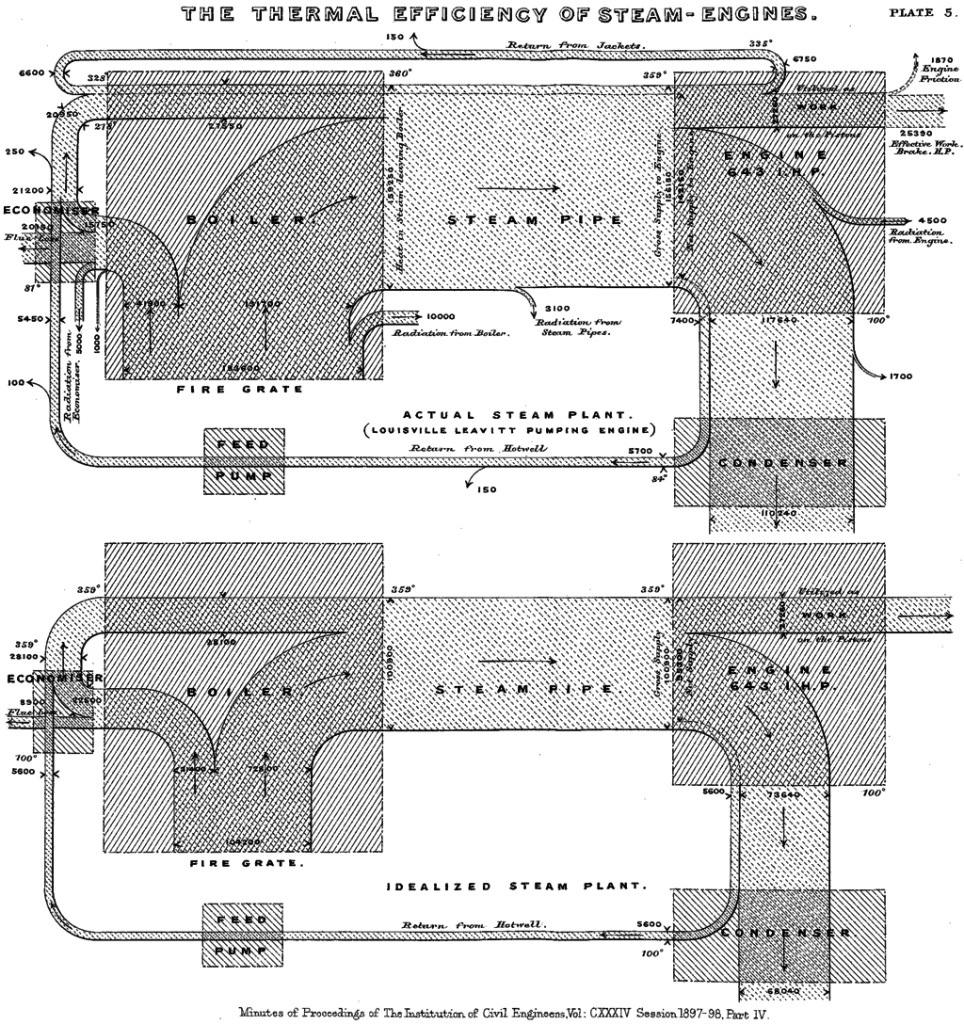
Sankey diagrams are named after Irish Captain Matthew Henry Phineas Riall Sankey, who used this type of diagram in 1898, in a classical diagram as shown next.
Let’s understand
Sankey diagram is the best representation of showing a flow of “something” from one system to another or say the flow of “something” from lower system to upper systems by depicting their contribution towards the main system and vice versa. let me show you a simple Sankey diagram to make it more clear.
An Electric Motor-
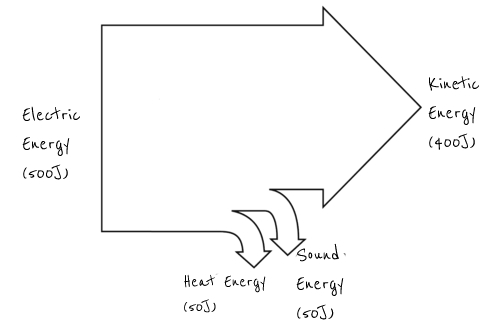
Let’s take an Electric motor for example. When an electric motor is switched on, suppose It consumes, 500J of energy for one go. the main objective of an electric motor is to achieve Kinetic energy, but wait here, an Electric motor, does not only produce Kinetic energy but also produce sound and heat energy. in the image above, the motor was consuming 500J and exhausted 50J each for sound and heat energy, and produces only 400J of Kinetic energy.
The Diagram is ver comprehensive and tells a story with ease. We can simply say, the energy loss in the form of Heat and Sound energy is a significant number, and what is the end product is left.
In the Sankey Diagram width of the arrow at one end shows the output left after completion of certain processes therefore the length of the arrow does not matter only the width matters most which can show us the energy leakage at different places/processes in case of an electric motor.
Sankey diagram perfectly shows what’s happening in the system in the first place and makes it easier to comprehend for the end-user.
Do you think there can be a better representation of this data? Please comment on the blog, we can discuss it in detail.
Use Cases
Now we have understood what a Sankey chart can depict with an analogy/example of an Electric Motor. but how is it going to help with data analysis or real business scenarios?
According to the definition of a Sankey Diagram, it can depict the “Flow” of “something”. we got our answer. the “Flow” of “Something” can be “Flow” of “Money” in the system. If it is Sales data at multilevel, it’s the “inflow” of money through various channels, if it is market campaign expenses, it is the “outflow” of the money from the system. In both cases, the Sankey diagram can tell us where we are leaking money for the marketing campaign or what places/stores/websites are contributing most to our sales in a single diagram.
Type of Data we need
In this blog, I am going to talk about sales data of, say “xyzexample.com” company, which operates in India, primarily in 4 states and in some of their cities. below is the image of the data set I picked, you can prepare it easily in an excel worksheet.
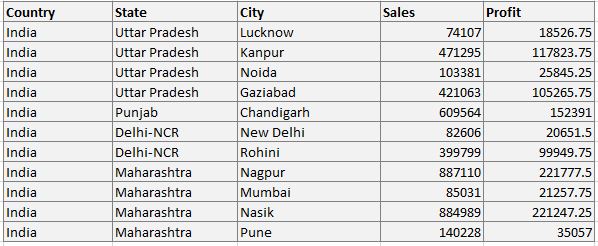
If you see the data their sales happening at different city stores of a state. we can understand from data Country, State, and City must be having a logical relationship to channel the flow of money either outward(Expenses) or inwards(Sales).
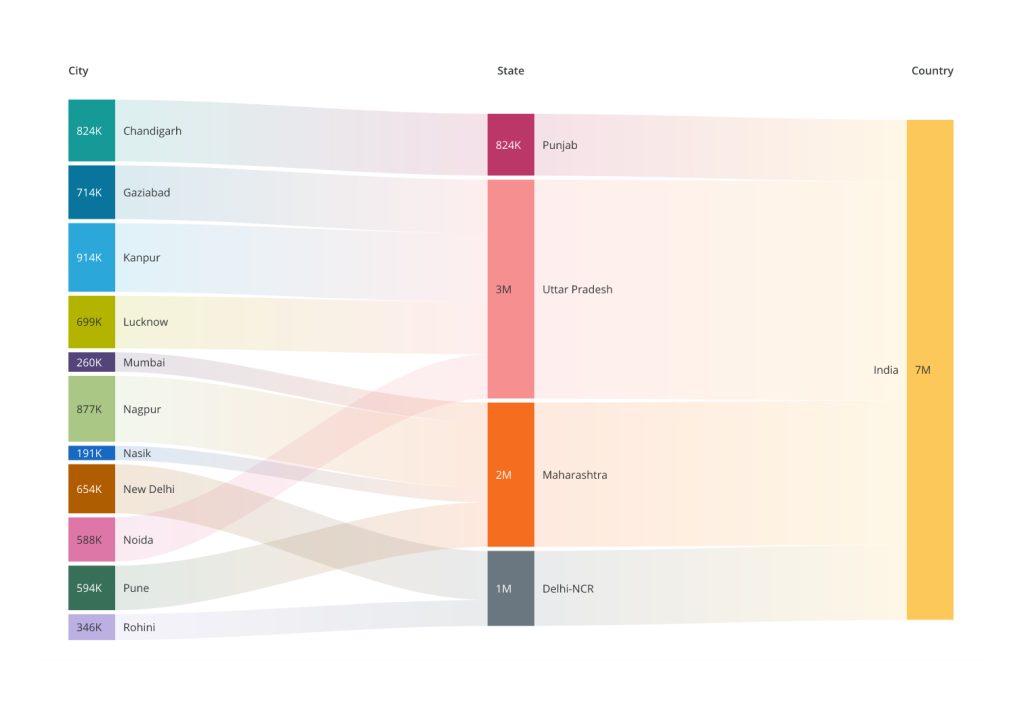
“Sales” here is going to be our prime KPI which is flowing inwards, and three-dimension(level) of the data, we call them attributes in MicroStrategy-City, State, and Country. Check below, what the Sankey Diagram going to look like in MicroStrategy Dossier.
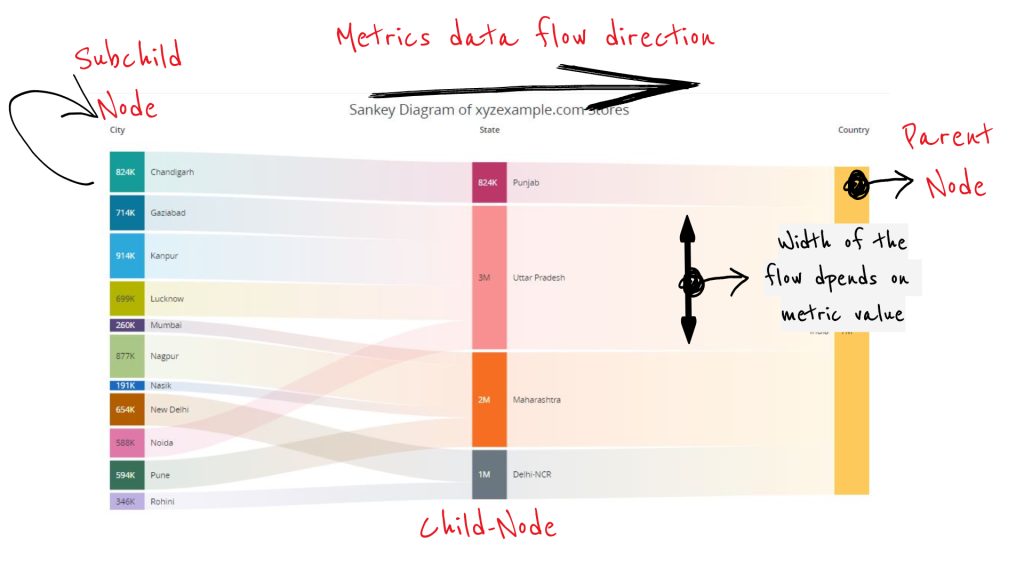
Don’t worry, about the handwritten texts and arrows, those I just added to explain this diagram. I know you are missing some sort of arrow here, but remember Sankey Diagram is for showing the flow of something, the direction of flow is an understood context whether left to right or right to left and with the above data example, we can understand the direction of sales contribution is towards country-level sales.
You can understand from the diagram that despite having 4 cities Maharastra state is contributing less to the country level sale as compared to Uttar Pradesh state having the same number of cities. See how easily you are able to comprehend this diagram.
I hope this blog helped you to understand the Sankey Diagram and its use case, want to create one in MicroStrategy read this blog.