Lowest and Highest Thresholds in MicroStrategy
Ever tried Quick Threshold editor in MicroStrategy Dossier? you might have, but want to learn how MicroStrategy distributes metrics data in 2 or 3 or 5 different colors using Lowest and Highest operators? Well, welcome to the blog.
In this blog, I will try to explain, How MicroStrategy bucketize your metrics data in different colors based on “Lowest” and “Highest” operators using the Rank function.
Sample Data
First of all, we need some sample data to play around with. I have created dummy data, which you can download here. How does it look, you can see it in the image below.
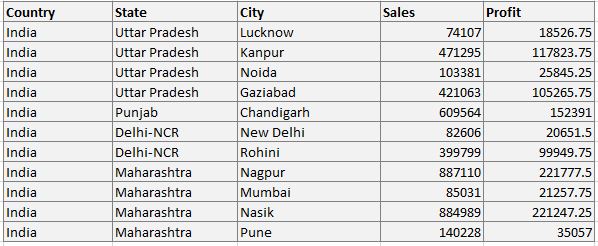
Our data has 3 entities Country, State, and City. We will deal only with the Sales column here.
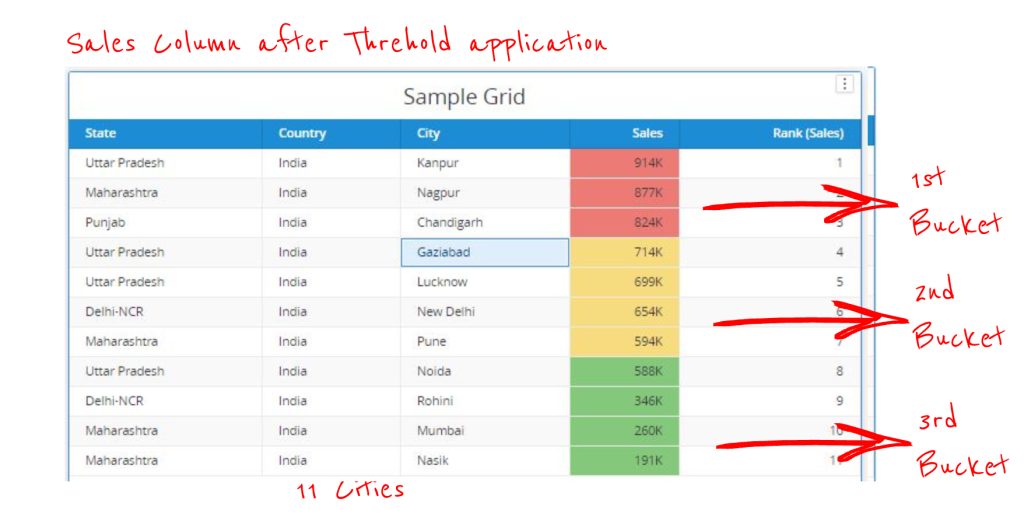
Based on the above data I have created a simple Grid in a Dossier as shown below. If you want to learn how to create Dossier Grid based on excel data, you can read my blog here.
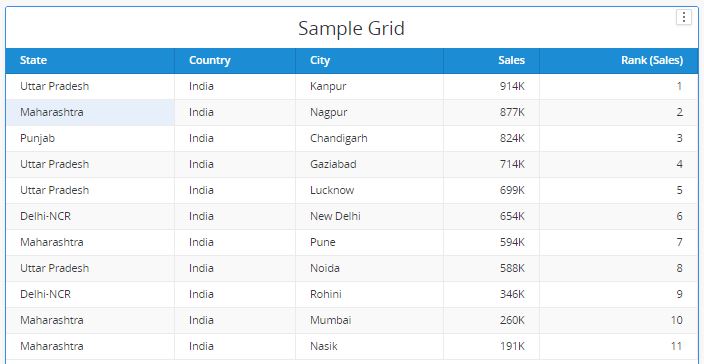
In our dataset, I have created an additional metric Rank(Sales) which gives ranks to the sales data in ascending order. You can ignore this Rank Metric, it is there just for explanation. I have also sorted out Grid in descending order based on Sales Metric values.
Apply Threshold
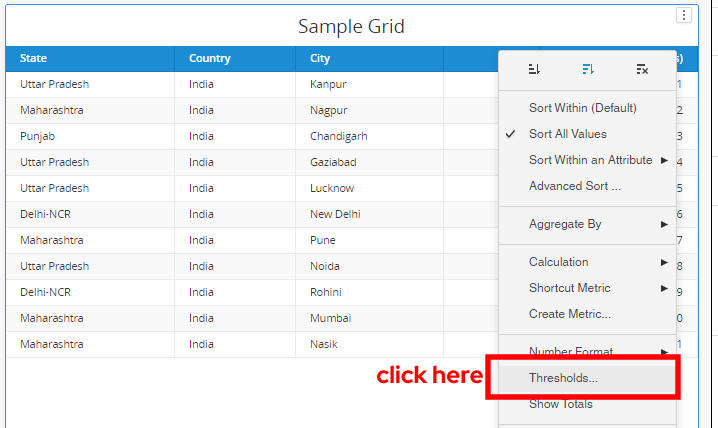
Now, on our Sales metric, we want to apply some thresholds, using threshold editor. how to open that editor check image below. Simply right-click on Sales column in Grid, and the click “Thresholds” option.
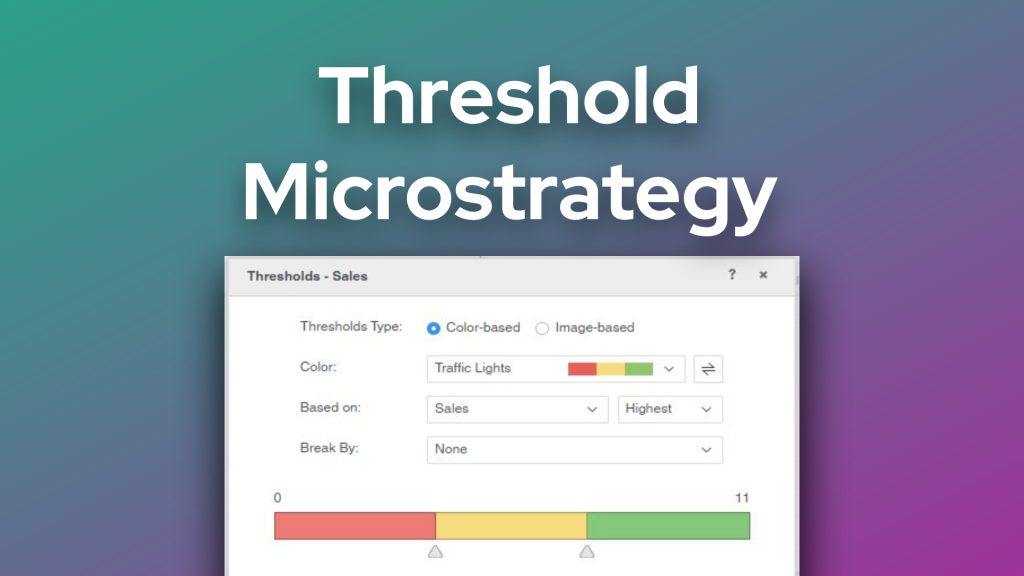
Quick Threshold Editor Window
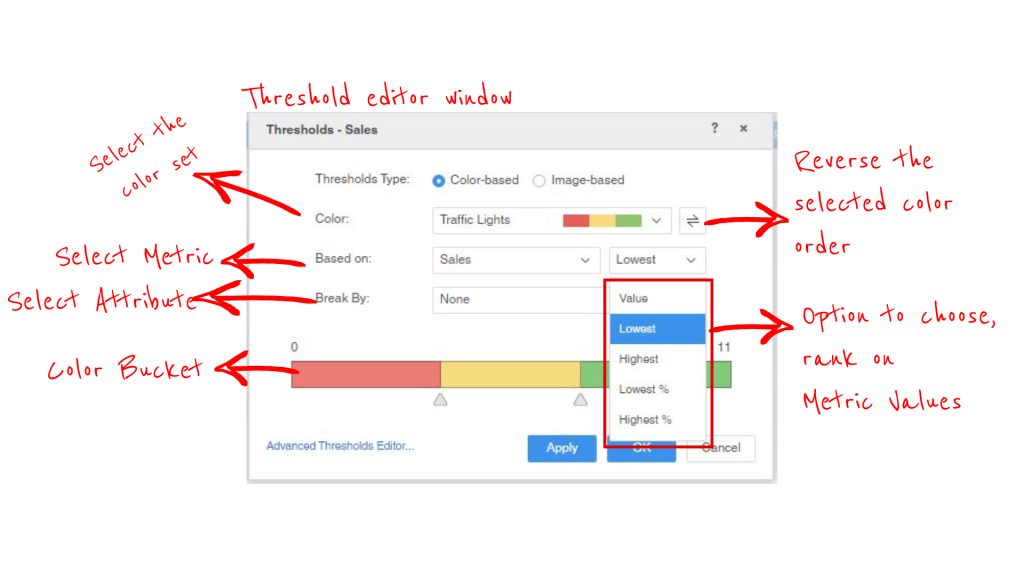
The above image is the Quick threshold editor window, where you get loads of options and settings to apply to your Grid column. As the image is showing, I have applied “Traffic Lights” as my 3 color buckets, “Sales” as my metric, “None” as an attribute, and “Lowest” as the Rank option to apply a threshold on my Sales Column. Let’s check now, What MicroStrategy has done with the column “Sales” and how it has divided sales numbers in different colors.
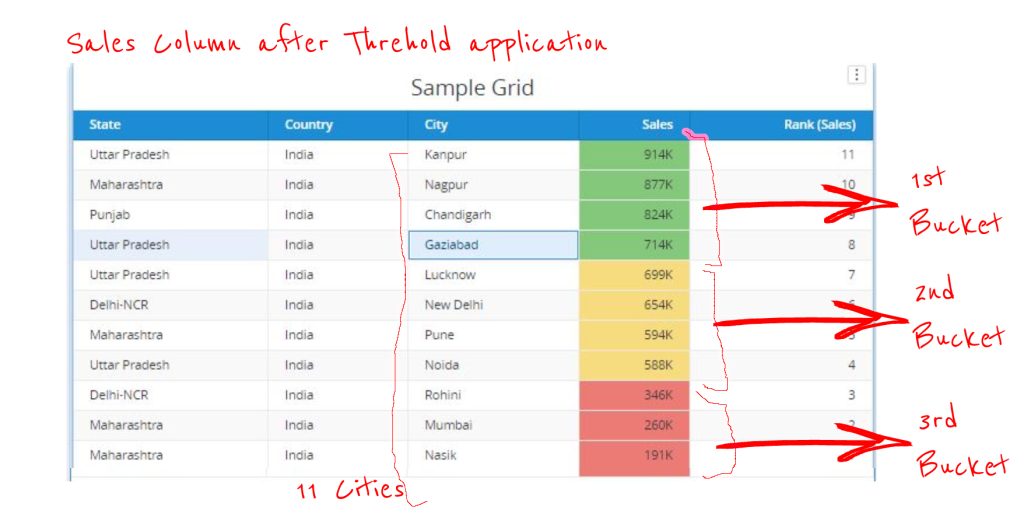
When we observe the above image, we see, why Green and Amber Bucket got 4 values each and Red Bucker got only 3 values? Isn’t weird? the distribution could be 3,3,5 or 3,4,4 like that, why it is 4,4,3? there must be some logic right? If you see the data, we got 11 cities Sales, therefore we got 11 different ranks. “Rank” yes that rings a bell, where the logic resides.
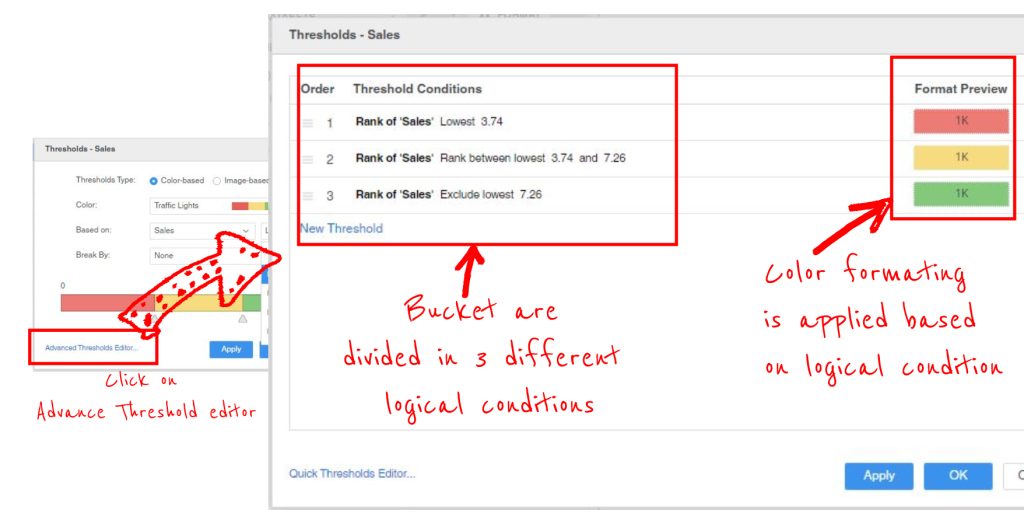
So how MicroStrategy is working here, to understand this, we first have to check how these “on the go” settings applied in Quick Threshold editor, are converting into “if-else” logical conditions in the Advanced Threshold editor window, check the image below.
Explanation –
So one thing is clear here, MicroStrategy is basically creating an implicit Rank metric on sales, and based on Rank values, it is applying 3 logical operations on top of that to change cells colors.
- Rank of Sales Lowest 3.74 – >should be Red
- Rank of Sales Rank between 3.74 and 7.26 -> should be Amber
- Rank of Sales Exclude Lowest 7.26 -> should be Green
To Better explain these conditions I have created another image, take look ahead.
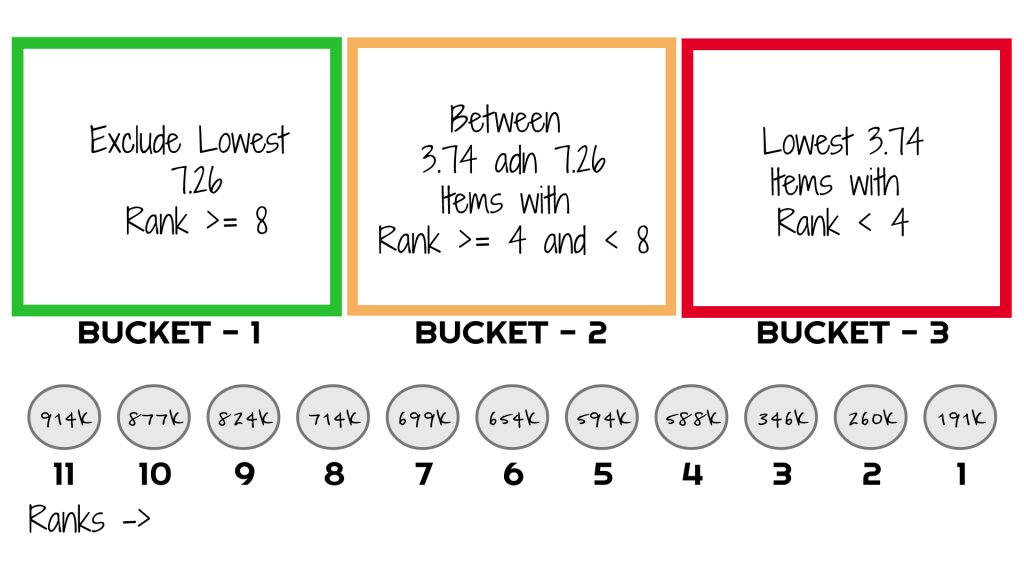
Items with a Rank less than equal to 4 will go to the Red bucket, items with a rank greater than 4 and less than equal to 8 will go to Amber Bucker, and items with a rank greater than 8 will go to Green Bucket.
Lowest Operator
So the big question here is why 3.74 is coming to select the lowest values for Red Bucket. the formula is simple. Since we have selected “Lowest” as the operator here, and 3 color buckets to distribute our sales numbers, now MicroStrategy has to first fill up the lowest bucket which is redone with the below formula.
Ranks in Red bucket = Total Ranks/number of buckets
In our case, it will be 11/3 -> which is 3.7 which means items with ranks lesser than 3.7 will be in the red bucket Now Amber Bucket, what items it will hold ? simple, It will first deduct the number of ranks of the red bucket from total ranks.
Ranks in Amber Bucket = (Total Ranks – Ranks in Red Bucket)
-> (11 – 3.7) -> 7.2, it means MicroStrategy will start filling up items with ranks greater than 3.7 and less than 7.2 in Amber Bucket, Ranks 4 to 7.
Ranks in the Green bucket are simply the remaining ranks, which are left after the red and amber buckets.
Ranks in Green Bucket = Ranks remaining (Ranks greater than 7.2)
We have understood here that the number of the color bucket we are choosing and the total ranks(items) we have is directly impacting the threshold distribution on our sales numbers. And MicroStrategy is filling up the lowest bucket first, and others thereafter. if the bucket number is 5(just try yourself) it will get 2.2 numbers based on our formula for the lowest bucket, and once it will start dividing, 4 buckets will have 2 items each and the 5th bucket will have 3 items, a fair distribution.
Highest
By its literal meaning, it will be the just reverse of lowest, this time MicroStrategy has to first fill up a bucket with items with higher rank in Red Bucket and so on.
- Rank of Sales Highest 3.74 – >should be Red
- Rank of Sales Rank between 3.74 and 7.26 -> should be Amber
- Rank of Sales Exclude Highest 7.26 -> should be Green
Try changing “Lowest” to “Highest” in the Quick Threshold editor, you get thresholds like below.
If we apply the same formula, Red Bucket will have items ranking less than 3.7, Amber Bucket will have items ranking 4 to 7 and Green Bucket will have items 8 to 11.
I hope this will help you now to understand how “Lowest” and “Highest” operators work with the Ranks function in the Threshold editor.
Please leave a comment, subscribe if you like the blog post.
Happy Learning, Keep Sharing!