How to Create Grid in MicroStrategy Dossier
Today we are going to see, how you can create a Grid in MicroStrategy Dossier in less than 5 min.
Sample Data
First of all, we need sample data to create our Dossier, I have created one dummy data file, which you can download here, how does it look? check the below image.
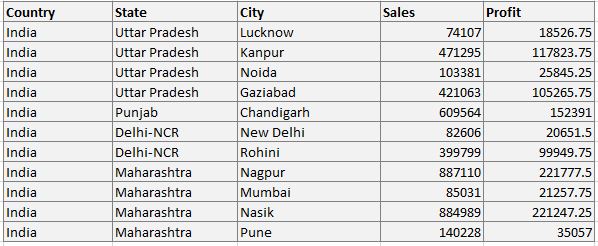
Let’s say we have an organization xyzexample.com, which operates its retail stores in India, primarily in 4 states and in some of their cities. above is the image of the data set I picked, you can prepare it easily in an excel worksheet.
“Sales” here is going to be our prime KPI which is flowing inwards, at three-dimension(level) of the data, we call them attributes in MicroStrategy, here – City, State, and Country. I have notified in the image above what our “Parent”, “Child” and “Sub-Child” attributes are going to be, don’t worry I am not going to talk about any hierarchy creation here.
First, we are going to see how to bring this data into MicroStrategy. be prepared with an excel worksheet with such data.
Create a Dossier
Once you have started creating a dossier you can see this type of window, shown in the image below, don’t, whether you are creating a Dossier from Workstation or from MicroStrategy Web.
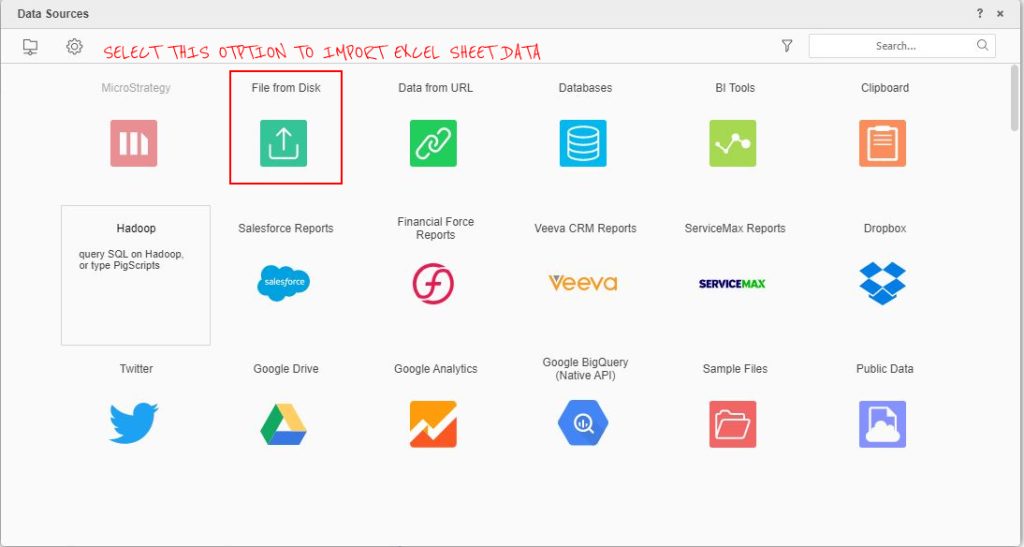
Import the Data
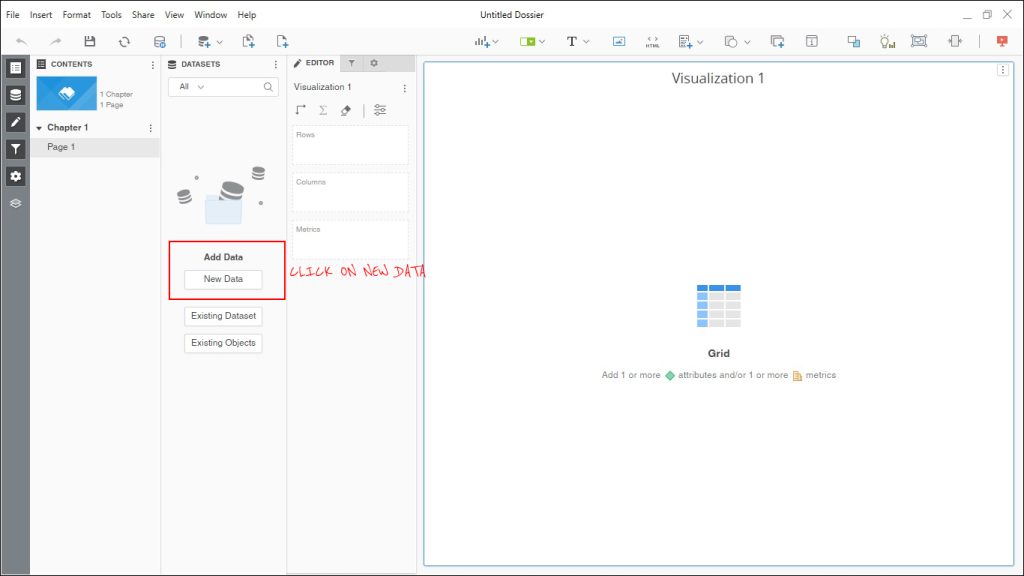
Step-1 – Click on the “Add Data” option under the “Datasets” tab.
Step – 2 – Select the “File from Disk” Option in the open popup, as shown below.
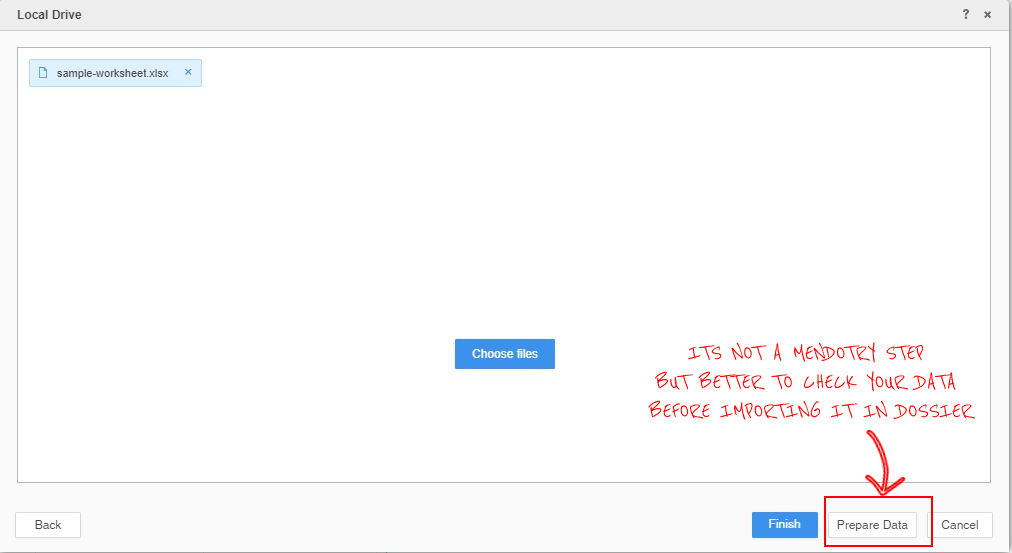
Step-3 – If you want to modal/clean/sanitize this data, say some formatting before importing it to Dossier, click on the “Prepare Data” option else never mind, just click on “Finish” and skip Step-4 as shown in the next step.
Step-4 – If you have the same data as I showed above, you don’t need to do anything here, everything is just fine, else there are a number of things you can decide here, like the creation of the relationship between attributes, what column must be a metric and what must be an attribute and other stuff like that; we will talk about that in some other blog.
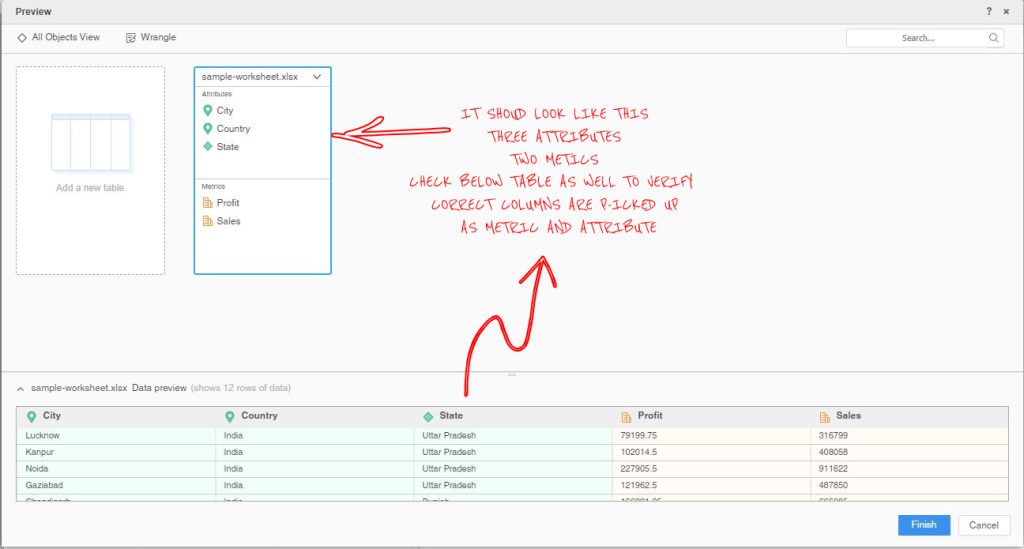
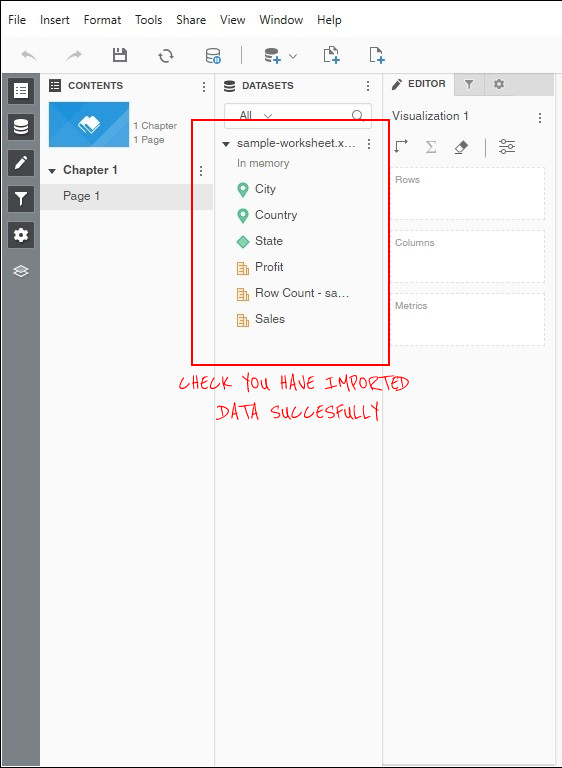
Step-5 – Once you click “Finish” in Step-4, your data is converted to the ready-to-use dataset in MicroStrategy. After import we see that we have 3 Attributes “Country, “State” and “City”, on the other hand, we have 2 metrics “Profit” and “Sales”.
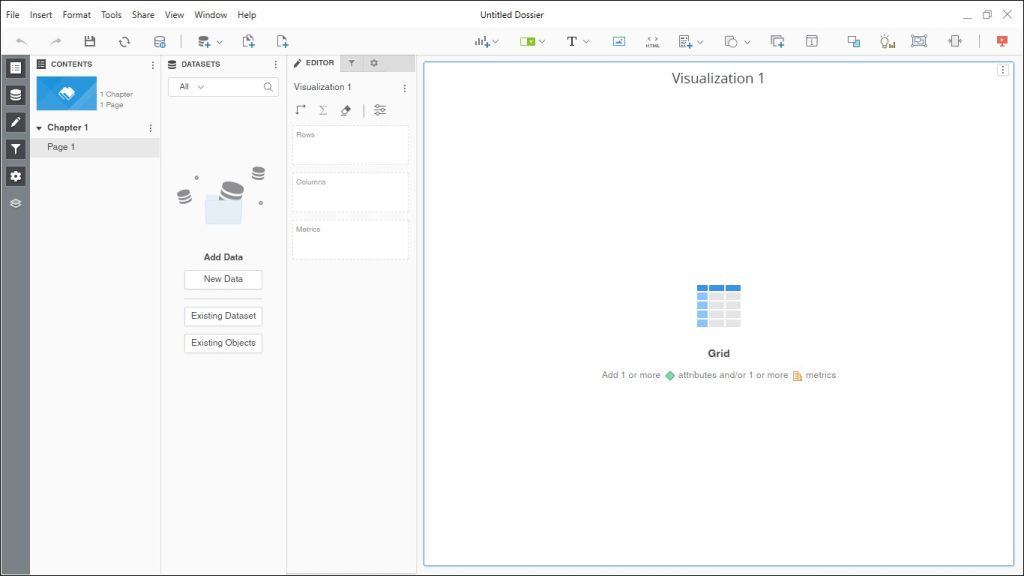
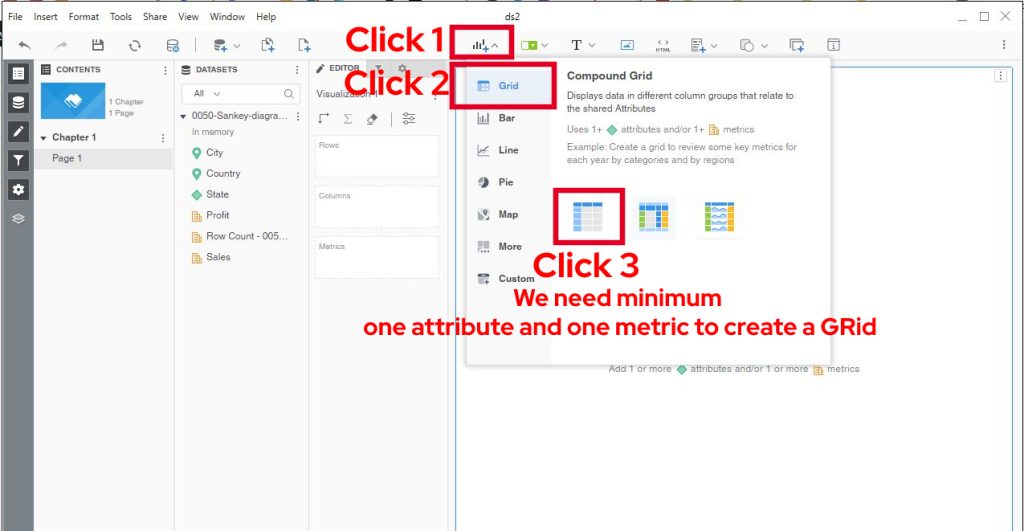
Grid
When you first open a Dossier, after adding a dataset to it, the default visualization shown would be Grid, but anyway check the below image how to add one Grid in your dossier.
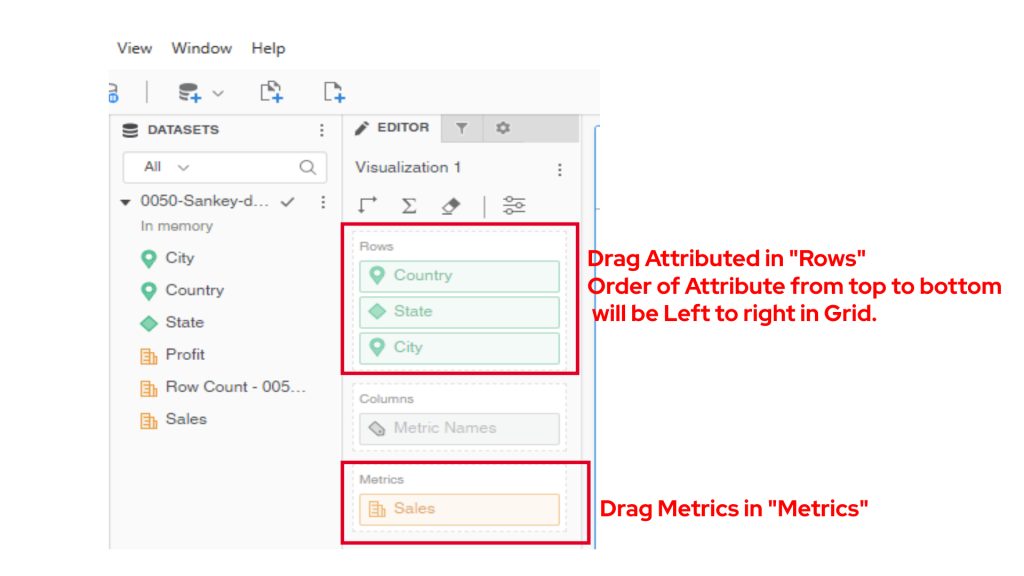
Once you add a Grid, you have to drag and drop your metrics in the “Metric” Area and Attributes to the “Rows” area as shown below.
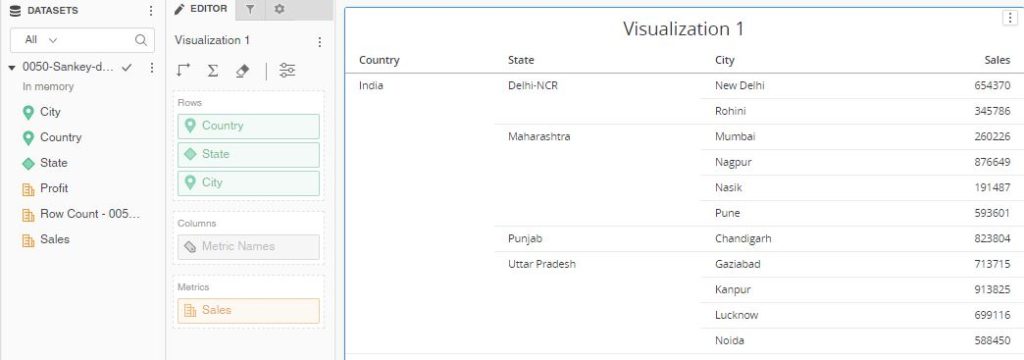
By Default, your Grid will look like the below image.
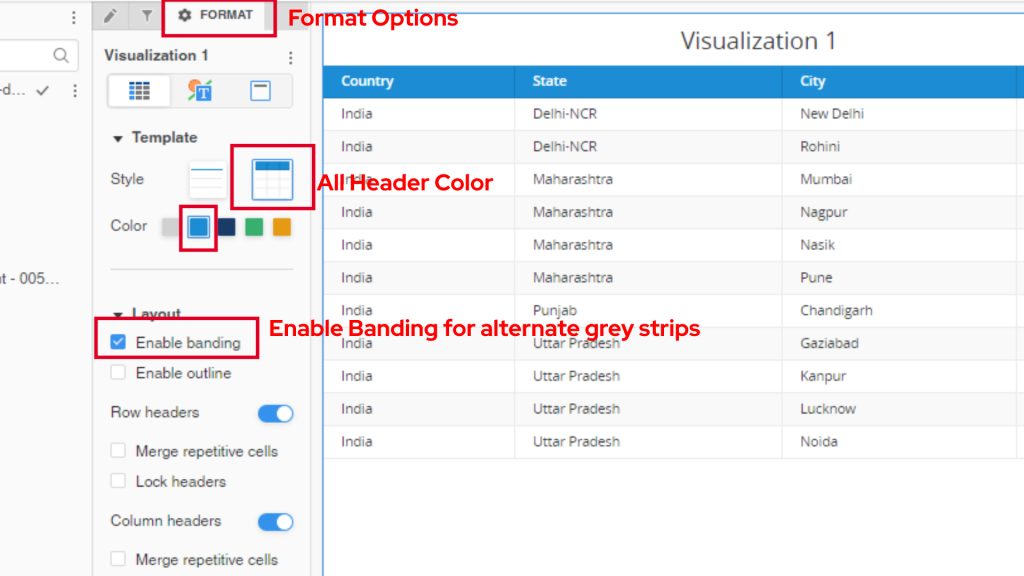
Formatting of Grid
You can apply Certain Format options(There are endless) to make your Grid more attractive and user-friendly.
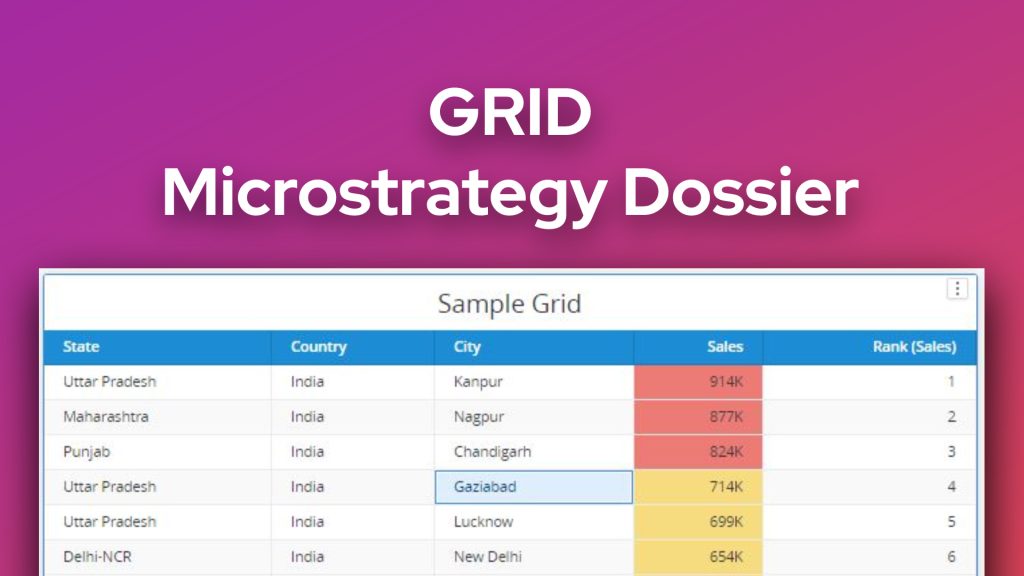
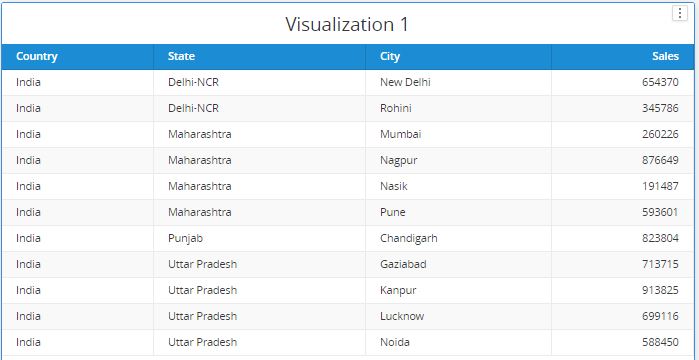
Final Grid
Below is our Final Grid after applying all the formatting.
Want to learn how to apply Threshold on this Grid read another blog here.
Happy Reading, Keep Sharing!